Algebra 1 (Eureka Math Squared-aligned)
This course contains Khan Academy practice problems crafted to support the Eureka Math Squared (EM2) curriculum. Designed to make it easier for districts, teachers, and students to find and use practice problems that complement EM2 lessons, this course was not produced in official partnership with Eureka Math Squared.
6 units257 videos22 hours
Learn it live with a class on Puzzicle · Teachers: use it with your class
Unit 1: Expressions, equations, and inequalities in one variable
The commutative, associative, and distributive properties
 Associative and commutative properties of addition with negatives ✓ Check-ins4:58
 Equivalent expressions with negative numbers ✓ Check-ins10:13
 Equivalent expressions ✓ Check-ins1:58
 Combining like terms with negative coefficients4:42
 Combining like terms with negative coefficients & distribution ✓ Check-ins4:07
Polynomial expressions

Adding and subtracting polynomial expressions
Multiplying polynomial expressions
Polynomial identities
Printing pressed
Solution sets for equations and inequalities in one variable
Solving linear equations in one variable
 Why we do the same thing to both sides: Variable on both sides ✓ Check-ins7:36
 Intro to equations with variables on both sides ✓ Check-ins8:53
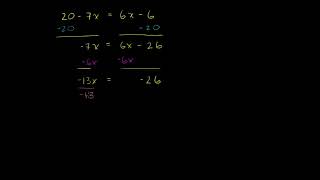 Equations with variables on both sides: 20-7x=6x-64:06
 Equations with parentheses ✓ Check-ins6:04
 Equation with variables on both sides: fractions4:49
 Reasoning with linear equations ✓ Check-ins7:40
Writing and solving equations in one variable
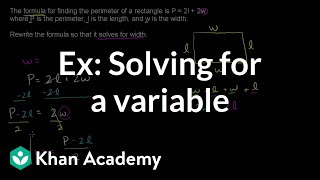
Rearranging formula

Solving linear inequalities in one variable
Solving and graphing compound inequalities
Solving absolute value equations
 Intro to absolute value equations and graphs ✓ Check-ins10:41
 Solving absolute value equations ✓ Check-ins6:46
 Worked example: absolute value equations with one solution ✓ Check-ins2:36
 Worked example: absolute value equation with two solutions ✓ Check-ins4:50
 Worked example: absolute value equations with no solution ✓ Check-ins3:50
Solving absolute value inequalities
Distributions and their shapes
Describing the center of a distribution

Using center to compare data distributions
Describing variability in a univariate distribution using standard deviation
Estimating variability in data distributions
Comparing distributions of univariate data
Unit 2: Equations and inequalities in two variables
Solution sets of linear equations in two variables
Graphing linear equations in two variables
 Intro to intercepts ✓ Check-ins6:33
 Intercepts from an equation ✓ Check-ins4:08
 Slope and y-intercept from equation ✓ Check-ins4:10
 Worked examples: slope-intercept intro ✓ Check-ins3:46
 Graphing a linear equation: 5x+2y=20 ✓ Check-ins4:29
 Intro to linear equation standard form8:07
 Point-slope & slope-intercept equations ✓ Check-ins7:07
Creating linear equations in two variables
Solution sets of linear equations in two variables
Graphing linear inequalities in two variables
Applications of linear equations and inequalities
Low-flow showerhead
Systems of linear equations in two variables
A new way to solve systems
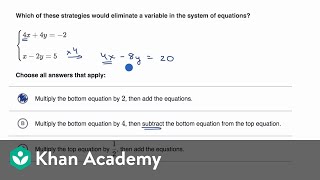

The elimination method
Applications of systems of equations
 System of equations word problem: walk & ride ✓ Check-ins7:00
 System of equations word problem: no solution ✓ Check-ins5:03
 System of equations word problem: infinite solutions ✓ Check-ins5:01
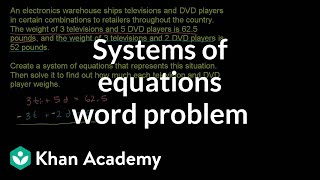 Systems of equations with elimination: TV & DVD ✓ Check-ins5:51
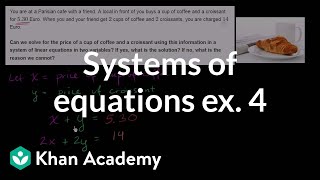 Systems of equations with elimination: coffee and croissants ✓ Check-ins4:15
 Setting up a system of linear equations example (weight and price) ✓ Check-ins4:12
Solution sets of systems of linear inequalities
Graphing solution sets of systems of linear inequalities

Applications of systems of linear inequalities
Relationships between quantitative variables
Using lines to model bivariate quantitative data
Modeling relationships with a line
Calculating and analyzing residuals
Analyzing residuals
Analyzing bivariate quantitative data
Summarizing bivariate categorical data with two-way tables
Bivariate categorical data and conditional relative frequency tables
Conditional relative frequencies and association

Unit 3: Functions and their representations
The definition of a function
Representing, naming, and evaluating functions
 What is a function? ✓ Check-ins7:57
 Examples finding the domain of functions ✓ Check-ins4:25
 Worked example: determining domain word problem (all integers) ✓ Check-ins5:34
 Function notation example ✓ Check-ins2:13
 Worked example: Evaluating functions from graph ✓ Check-ins0:44
 Worked example: evaluating expressions with function notation ✓ Check-ins1:23
 Function notation word problem: beach ✓ Check-ins2:36
 Function notation word problem: bank ✓ Check-ins3:24
The graph of a function
Representations of functions
Exploring key features of a function and its graph
Identifying key features of a function and its graph
Representing functions from verbal descriptions
Using graphs to solve equations
Comparing functions
Piecewise linear functions

Building new functions—translations
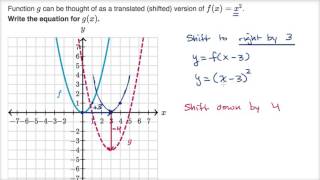
Building new functions—reflections
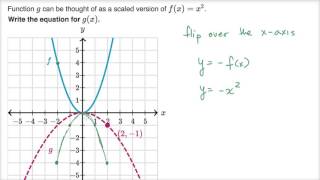
Building new functions—vertical scaling
Building new functions—horizontal scaling
A summary of transforming the graph of a function
Unit 4: Quadratic functions
Falling objects
Projectile motion
Analyzing functions that model projectile motion
Graphs of quadratic functions
Solving quadratic equations by factoring: Identities and guess and check
Creating and solving quadratic equations in one variable
Zeros of functions
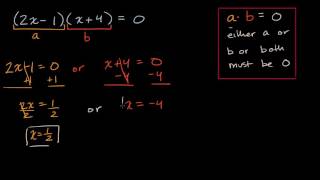
Graphing quadratic functions from factored form
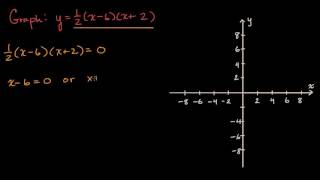
Using square roots to solve quadratic equations
 Solving quadratics by taking square roots examples ✓ Check-ins5:12
 Quadratics by taking square roots: strategy ✓ Check-ins1:45
 Solving quadratics by taking square roots: with steps ✓ Check-ins4:25
 Worked example: rational vs. irrational expressions (unknowns) ✓ Check-ins6:26
 Worked example: rational vs. irrational expressions ✓ Check-ins2:36
Solving quadratic equations by completing the square
Deriving the quadratic formula
Solving quadratic equations
Rewriting square roots
The quadratic formula and zeros of a function
Transforming the graphs of quadratic functions
Completing the square to graph quadratic functions
Creating equations of quadratic functions to model contexts
Another look at systems of equations


Unit 5: Linear and exponential functions
Exploring patterns
The recursive challenge
Arithmetic and geometric sequences
Representations of arithmetic and geometric sequences
Exponential functions
Rational exponents
Using transformations to graph exponential functions (bases greater than 1)
Using transformations to graph exponential functions (bases between 0 and 1)
Writing equations for exponential functions from tables or graphs
Calculating interest
Exponential growth
Modeling populations
Analyzing exponential growth
Comparing growth of functions
World population prediction
Unit 6: Modeling with functions
Analyzing paint splatters (Optional)
Using residual plots to select models for data
Populations of US cities
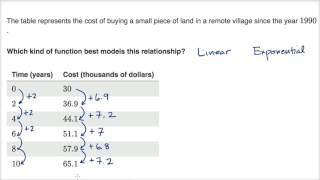
Designing a fundraiser
World record doughnut
Learn this with a class
With a class on Puzzicle this course runs as a timetable of live study parties: your batch watches together and answers the check-ins, sometimes with a teacher leading.
Course content © Khan Academy, used under CC BY-NC-SA. See this course on Khan Academy.