AP®︎/College Statistics
Learn a powerful collection of methods for working with data! AP® Statistics is all about formulating questions, collecting and analyzing data, and interpreting results from data.
19 units377 videos38 hours
Learn it live with a class on Puzzicle · Teachers: use it with your class
Unit 1: Exploring one-variable data and collecting data
Introducing statistics: what can we learn from data?
Variables
Tabular representation and summary statistics for one categorical variable
Graphical representations for one categorical variable

Graphical representations for one quantitative variable

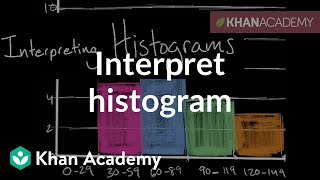

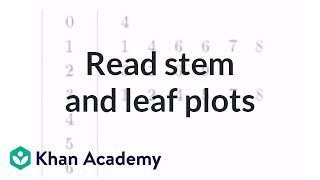
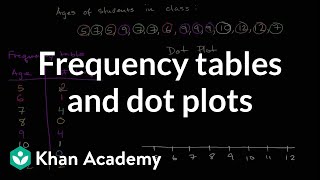
Descriptions for one quantitative variable distributions
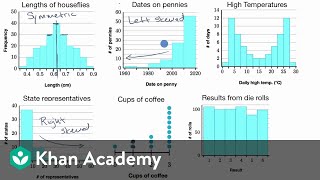
Summary statistics for one quantitative variable distributions
 Statistics intro: Mean, median, & mode ✓ Check-ins8:54
 Median in a histogram ✓ Check-ins2:28
 Estimating mean and median in data displays ✓ Check-ins4:35
 Interquartile range (IQR) ✓ Check-ins6:12
 Sample variance ✓ Check-ins10:38
 Sample standard deviation and bias ✓ Check-ins9:33
 Visually assessing standard deviation ✓ Check-ins3:49
 Mean and standard deviation versus median and IQR ✓ Check-ins7:59
Graphical representations of summary statistics for one quantitative variable
Comparisons of the distributions for one quantitative variable
The investigative question revisited and data collection
Random sampling
Potential problems with sampling
Unit 2: Probability, random variables, and probability distributions
Tabular and graphical representations for the distributions
Summary statistics for two categorical variables
Estimating probabilities using simulation
Introduction to probability
Mutually exclusive events

Conditional probability
Independent events and unions of events
 Compound probability of independent events ✓ Check-ins6:00
 Independent events example: test taking ✓ Check-ins4:44
 General multiplication rule example: independent events ✓ Check-ins2:29
 Dependent probability introduction ✓ Check-ins6:38
 General multiplication rule example: dependent events ✓ Check-ins2:39
Introduction to random variables and probability distributions
 Constructing a probability distribution for random variable ✓ Check-ins6:48
 Valid discrete probability distribution examples ✓ Check-ins4:00
 Probability with discrete random variable example ✓ Check-ins3:50
 Theoretical probability distribution example: tables ✓ Check-ins3:15
 Theoretical probability distribution example: multiplication ✓ Check-ins3:25
Parameters of random variables
The binomial distribution
 Binomial variables ✓ Check-ins7:31
 Recognizing binomial variables ✓ Check-ins6:42
 Expected value of a binomial variable ✓ Check-ins ✎ Fixed a slip6:33
 Variance of a binomial variable ✓ Check-ins ✎ Fixed a slip6:51
 Finding the mean and standard deviation of a binomial random variable ✓ Check-ins5:02
 Binomial probability example ✓ Check-ins ✎ Fixed a slip10:24
The normal distribution
 Qualitative sense of normal distributions ✓ Check-ins10:53
 Normal distribution problems: Empirical rule ✓ Check-ins10:25
 Standard normal table for proportion below ✓ Check-ins4:20
 Standard normal table for proportion above ✓ Check-ins5:07
 Standard normal table for proportion between values ✓ Check-ins7:10
 Threshold for low percentile ✓ Check-ins6:00
Unit 3: Inference for categorical data: proportions
Estimators
Sampling distributions for sample proportions
Constructing a confidence interval for a population proportion
 Conditions for valid confidence intervals for a proportion ✓ Check-ins6:44
 Conditions for confidence interval for a proportion worked examples ✓ Check-ins ✎ Fixed a slip4:54
 Critical value (z*) for a given confidence level ✓ Check-ins6:22
 Example constructing and interpreting a confidence interval for p ✓ Check-ins6:35
 Determining sample size based on confidence and margin of error ✓ Check-ins8:01
Setting up a test for a population proportion
P-values
Carrying out a test for a population proportion
Potential errors when performing tests
Sampling distributions for the difference between sample proportions
Constructing a confidence interval for the difference between two population proportions
Setting up a test for the difference between two population proportions
Carrying out a test for the difference between two population proportions
Setting up a chi-square test for homogeneity or independence
Unit 4: Inference for quantitative data: means
Sampling distributions for sample means
Constructing a confidence interval for a population mean or population mean difference
 Introduction to t statistics ✓ Check-ins ✎ Fixed a slip4:26
 Simulation showing value of t statistic ✓ Check-ins3:14
 Conditions for valid t intervals ✓ Check-ins4:54
 Example finding critical t value ✓ Check-ins ✎ Fixed a slip3:59
 Example constructing a t interval for a mean ✓ Check-ins5:58
 Confidence interval for a mean with paired data ✓ Check-ins9:46
Setting up a test for a population mean or population mean difference
Carrying out a test for a population mean or population mean difference
 When to use z or t statistics in significance tests ✓ Check-ins4:51
 Example calculating t statistic for a test about a mean ✓ Check-ins5:02
 Using TI calculator for P-value from t statistic ✓ Check-ins3:19
 Using a table to estimate P-value from t statistic ✓ Check-ins4:53
 Comparing P-value from t statistic to significance level ✓ Check-ins3:39
 Free response example: Significance test for a mean ✓ Check-ins11:53
Sampling distributions for the difference between two sample means
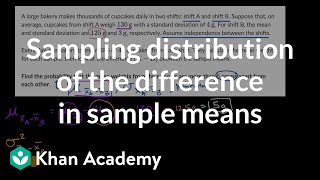
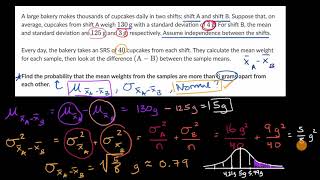
Constructing a confidence interval for the difference between two population means
Setting up a test for the difference between two populations means
Carrying out a test for the difference between two population means
Unit 5: Regression analysis
Graphical representations between two quantitative variables
Correlation
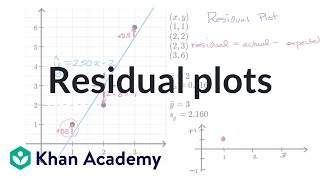
Residuals
Unit 6: Exploring categorical data
The language of variation: Variables
Representing a categorical variable with graphs
Representing two categorical variables
Statistics for two categorical variables
Unit 7: Exploring one-variable quantitative data: Displaying and describing
Representing a quantitative variable with dot plots
Representing a quantitative variable with histograms and stem plots
Describing the distribution of a quantitative variable
Comparing distributions of a quantitative variable
Unit 8: Exploring one-variable quantitative data: Summary statistics
Measuring center in quantitative data
More on mean and median
Measuring variability in quantitative data
Effects of linear transformations
More on standard deviation (optional)
Graphical representations of summary statistics
Unit 9: Exploring one-variable quantitative data: Percentiles, z-scores, and the normal distribution
Percentiles
Density curves
Normal distributions and the empirical rule
Normal distribution calculations
Unit 10: Exploring two-variable quantitative data
Representing the relationship between two quantitative variables
Correlation
Residuals
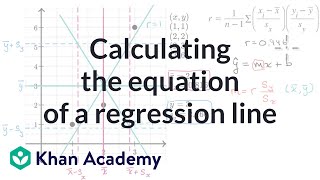
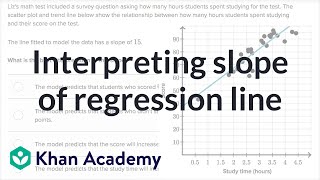
Least-squares regression
Analyzing departures from linearity
 R-squared or coefficient of determination ✓ Check-ins12:41
 Standard deviation of residuals or root mean square deviation (RMSD) ✓ Check-ins ✎ Fixed a slip7:06
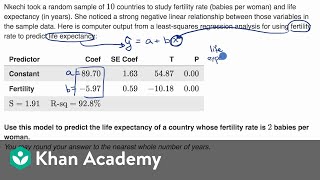
 Interpreting computer regression data ✓ Check-ins5:13
 Impact of removing outliers on regression lines ✓ Check-ins5:44
 Influential points in regression ✓ Check-ins4:15
 Transforming nonlinear data ✓ Check-ins2:55
 Worked example of linear regression using transformed data ✓ Check-ins7:40
Unit 11: Collecting data
Introduction to planning a study
Potential problems with sampling
Random sampling and data collection
Introduction to experimental design
Inference and experiments
Unit 12: Probability
Estimating probabilities using simulation
Mutually exclusive events and unions of events
Conditional probability
Independent versus dependent events and the multiplication rule
- Compound probability of independent events ✓ Check-ins6:00
- Independent events example: test taking ✓ Check-ins4:44
- General multiplication rule example: independent events ✓ Check-ins2:29
- Dependent probability introduction ✓ Check-ins6:38
- General multiplication rule example: dependent events ✓ Check-ins2:39
 "At least one" probability with coin flipping ✓ Check-ins9:20
Unit 13: Random variables and probability distributions
Introduction to random variables and probability distributions
- Constructing a probability distribution for random variable ✓ Check-ins6:48
- Valid discrete probability distribution examples ✓ Check-ins4:00
- Probability with discrete random variable example ✓ Check-ins3:50
- Theoretical probability distribution example: tables ✓ Check-ins3:15
- Theoretical probability distribution example: multiplication ✓ Check-ins3:25
Mean and standard deviation of random variables
Transforming random variables
Combining random variables
 Mean of sum and difference of random variables ✓ Check-ins3:22
 Variance of sum and difference of random variables ✓ Check-ins8:07
 Intuition for why independence matters for variance of sum ✓ Check-ins4:23
 Deriving the variance of the difference of random variables ✓ Check-ins10:47
 Example: Analyzing distribution of sum of two normally distributed random variables ✓ Check-ins5:51
 Example: Analyzing the difference in distributions ✓ Check-ins9:45
Introduction to the binomial distribution
- Binomial variables ✓ Check-ins7:31
- Recognizing binomial variables ✓ Check-ins6:42
 10% Rule of assuming "independence" between trials ✓ Check-ins6:43
- Binomial probability example ✓ Check-ins ✎ Fixed a slip10:24
 Generalizing k scores in n attempts ✓ Check-ins ✎ Fixed a slip4:13
 Free throw binomial probability distribution ✓ Check-ins8:39
 Graphing basketball binomial distribution ✓ Check-ins4:22
 Binompdf and binomcdf functions ✓ Check-ins5:27
Parameters for a binomial distribution
The geometric distribution
 Geometric random variables introduction ✓ Check-ins6:15
 Geometric distribution mean and standard deviation ✓ Check-ins6:26
 Probability for a geometric random variable ✓ Check-ins2:51
 Cumulative geometric probability (greater than a value) ✓ Check-ins ✎ Fixed a slip5:03
 Cumulative geometric probability (less than a value) ✓ Check-ins4:07
 TI-84 geometpdf and geometcdf functions ✓ Check-ins5:48
 Proof of expected value of geometric random variable ✓ Check-ins7:19
Unit 14: Sampling distributions
The normal distribution, revisited
The central limit theorem
Biased and unbiased point estimates
Sampling distributions for sample proportions
Sampling distributions for differences in sample proportions
Sampling distributions for sample means
Sampling distributions for differences in sample means
Unit 15: Inference for categorical data: Proportions
Introduction to confidence intervals
Confidence intervals for proportions
- Conditions for valid confidence intervals for a proportion ✓ Check-ins6:44
- Conditions for confidence interval for a proportion worked examples ✓ Check-ins ✎ Fixed a slip4:54
- Critical value (z*) for a given confidence level ✓ Check-ins6:22
- Example constructing and interpreting a confidence interval for p ✓ Check-ins6:35
- Determining sample size based on confidence and margin of error ✓ Check-ins8:01
The idea of significance tests
Setting up a test for a population proportion
Carrying out a test for a population proportion
Concluding a test for a population proportion
Potential errors when performing tests
Confidence intervals for the difference of two proportions
Testing for the difference of two population proportions
 Hypothesis test for difference in proportions ✓ Check-ins9:19
 Constructing hypotheses for two proportions ✓ Check-ins4:51
 Hypothesis test for difference in proportions example ✓ Check-ins ✎ Fixed a slip10:28
 Comparing P value to significance level for test involving difference of proportions ✓ Check-ins2:30
 Confidence interval for hypothesis test for difference in proportions ✓ Check-ins5:30
Unit 16: Inference for quantitative data: Means
Constructing a confidence interval for a population mean
- Introduction to t statistics ✓ Check-ins ✎ Fixed a slip4:26
- Simulation showing value of t statistic ✓ Check-ins3:14
- Conditions for valid t intervals ✓ Check-ins4:54
- Example finding critical t value ✓ Check-ins ✎ Fixed a slip3:59
- Example constructing a t interval for a mean ✓ Check-ins5:58
- Confidence interval for a mean with paired data ✓ Check-ins9:46
Setting up a test for a population mean
Carrying out a test for a population mean
- When to use z or t statistics in significance tests ✓ Check-ins4:51
- Example calculating t statistic for a test about a mean ✓ Check-ins5:02
- Using TI calculator for P-value from t statistic ✓ Check-ins3:19
- Using a table to estimate P-value from t statistic ✓ Check-ins4:53
- Comparing P-value from t statistic to significance level ✓ Check-ins3:39
- Free response example: Significance test for a mean ✓ Check-ins11:53
Confidence intervals for the difference of two means
Testing for the difference of two population means
 Hypotheses for a two-sample t test ✓ Check-ins4:00
 Example of hypotheses for paired and two-sample t tests ✓ Check-ins3:49
 Two-sample t test for difference of means ✓ Check-ins6:56
 Conclusion for a two-sample t test using a P-value ✓ Check-ins2:29
 Conclusion for a two-sample t test using a confidence interval ✓ Check-ins3:46
Unit 17: Inference for categorical data: Chi-square
Chi-square test for goodness of fit
Chi square tests for relationships (homogeneity or independence)
Unit 18: Inference for quantitative data: slopes
Confidence intervals for the slope of a regression model
Unit 19: Prepare for the AP®︎ Statistics Exam
Learn this with a class
With a class on Puzzicle this course runs as a timetable of live study parties: your batch watches together and answers the check-ins, sometimes with a teacher leading.
Course content © Khan Academy, used under CC BY-NC-SA. See this course on Khan Academy.