Integrated Math 1 (IM® v.360 aligned)
This course contains Khan Academy practice problems crafted to support the IM® v.360 curriculum by Illustrative Mathematics® (IM), licensed under Creative Commons/Attribution/Non-commercial 4.0. Designed to make it easier for districts, teachers, and students to find and use practice problems that complement IM v.360 lessons, this course was not produced in official partnership with Illustrative Mathematics.
9 units318 videos26 hours
Learn it live with a class on Puzzicle · Teachers: use it with your class
Unit 1: Constructions and rigid transformations

Constructing patterns

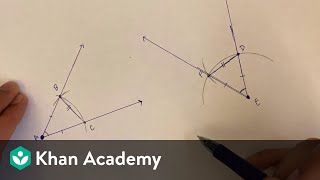
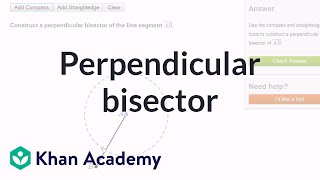
Construction techniques 1: perpendicular bisectors
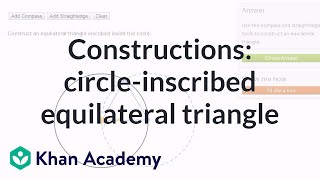
Construction techniques 2: equilateral triangles
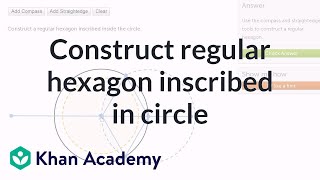
Construction techniques 3: perpendicular lines and angle bisectors
Construction techniques 4: parallel and perpendicular lines
Construction techniques 5: squares
Rigid transformations

Defining reflections
Defining translations

Defining rotations
Symmetry
More symmetry

Working with rigid transformations
Unit 2: Congruence
Congruent parts, part 2
Congruent triangles, part 1
Congruent triangles, part 2

Points, segments, and zigzags
Side-angle-side triangle congruence

Angle-side-angle triangle congruence

The perpendicular bisector theorem
Side-side-side triangle congruence
Practicing proofs

Side-side-angle (sometimes) congruence (optional)
Unit 3: One-variable statistics
Getting to know you
Data representations (Optional)
 Representing data ✓ Check-ins8:18
 Frequency tables & dot plots ✓ Check-ins7:19
 Creating a histogram ✓ Check-ins7:22
 Interpreting a histogram ✓ Check-ins4:29
 Reading box plots ✓ Check-ins3:18
 Constructing a box plot ✓ Check-ins8:18
 Worked example: Creating a box plot (odd number of data points) ✓ Check-ins3:18
 Worked example: Creating a box plot (even number of data points) ✓ Check-ins3:15
A gallery of data
The shape of distributions
Calculating measures of center & variability (optional)
The effect of extremes
Comparing & contrasting data distributions
Standard deviation
More standard deviation
Comparing data sets
Unit 4: Linear equations and systems
Planning a party
Writing equations to model relationships (part 1) (optional)
Writing equations to model relationships (part 2) (optional)
Equations and their solutions (optional)
Equations and their graphs (optional)
Explaining steps for rewriting equations
Which variable to solve for? (part 1)
Which variable to solve for? (part 2)
Connecting equations to graphs (part 1)
 Intro to intercepts ✓ Check-ins6:33
 x-intercept of a line ✓ Check-ins1:43
 Intercepts from an equation ✓ Check-ins4:08
 Intro to linear equation standard form ✓ Check-ins8:07
 Graphing a linear equation: 5x+2y=20 ✓ Check-ins4:29
 Interpreting linear equations in different forms ✓ Check-ins ✎ Fixed a slip5:01
 Slope, x-intercept, y-intercept meaning in context ✓ Check-ins4:00
 Linear graphs word problem: cats ✓ Check-ins2:43
Connecting equations to graphs (part 2)
Writing & graphing systems of linear equations
 Systems of equations: trolls, tolls (1 of 2) ✓ Check-ins6:51
 Systems of equations: trolls, tolls (2 of 2) ✓ Check-ins5:41
 Testing a solution to a system of equations ✓ Check-ins2:38
 Systems of equations with graphing: y=7/5x-5 & y=3/5x-1 ✓ Check-ins2:22
 Systems of equations with graphing: exact & approximate solutions ✓ Check-ins5:56
 Setting up a system of equations from context example (pet weights) ✓ Check-ins1:59
 Setting up a system of linear equations example (weight and price) ✓ Check-ins4:12
 Interpreting points in context of graphs of systems ✓ Check-ins5:39
Solving systems by substitution
Solving systems by elimination (part 1)
Solving systems by elimination (part 2)

Solving systems by elimination (part 3)
Systems of linear equations and their solutions
Unit 5: Coordinate geometry
Rigid transformations in a plane
 Translating points ✓ Check-ins3:51
 Translating shapes ✓ Check-ins1:55
 Determining translations ✓ Check-ins1:32
 Reflecting points ✓ Check-ins3:45
 Reflecting shapes ✓ Check-ins2:38
 Determining reflections ✓ Check-ins1:40
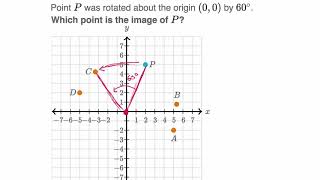 Rotating points ✓ Check-ins1:50
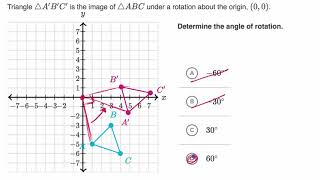 Determining rotations ✓ Check-ins2:57
 Rotating shapes ✓ Check-ins8:12
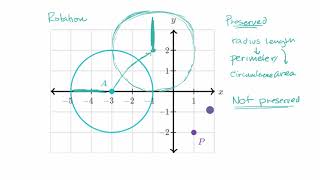 Rigid transformations: preserved properties ✓ Check-ins7:00
Transformations as functions
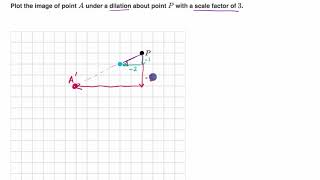
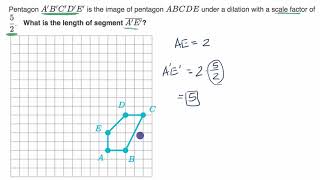
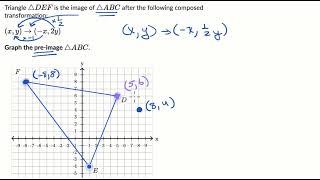
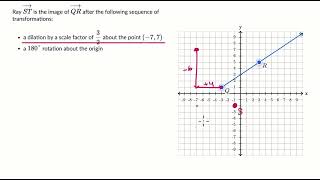
Types of transformations
 Similar shapes & transformations ✓ Check-ins2:38
 Translations: graph to algebraic rule ✓ Check-ins2:21
 Translations: description to algebraic rule ✓ Check-ins1:29
 Rotations: graph to algebraic rule ✓ Check-ins4:07
 Rotations: description to algebraic rule ✓ Check-ins4:15
 Reflections: graph to algebraic rule ✓ Check-ins2:28
 Reflections: description to algebraic rule ✓ Check-ins ✎ Fixed a slip2:39
 Representing dilations algebraically, k greater than 1 ✓ Check-ins3:56
 Representing dilations algebraically, k less than 1 ✓ Check-ins3:28
 Sequences of transformations ✓ Check-ins4:39
Equations of lines
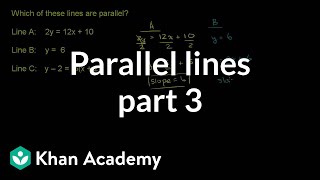
Parallel lines in the plane
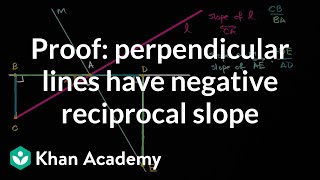
Perpendicular lines in the plane
It’s all on the line
Distances and triangles
Classifying with slope
Lines in triangles (optional)
Applying area and perimeter on the plane

Unit 6: Two-variable statistics
Relative frequency tables
Associations in categorical data
Linear models
 Bivariate relationship linearity, strength and direction ✓ Check-ins8:13
 Estimating the line of best fit exercise ✓ Check-ins1:17
 Fitting a line to data ✓ Check-ins7:48
 Line of best fit: smoking in 1945 ✓ Check-ins4:47
 Estimating with linear regression (linear models) ✓ Check-ins3:23
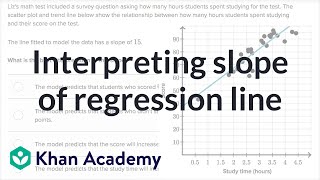 Interpreting slope of regression line ✓ Check-ins2:58
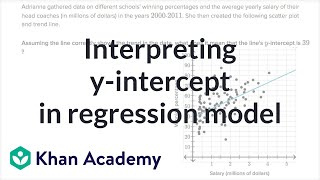 Interpreting y-intercept in regression model ✓ Check-ins2:36
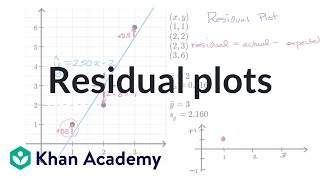
Residuals
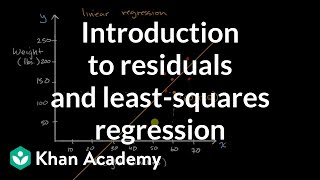
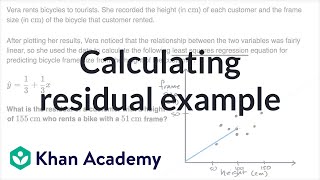
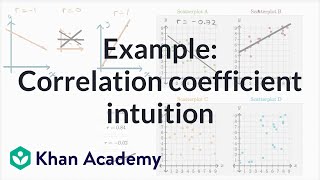
The correlation coefficient
Unit 7: Linear inequalities and systems
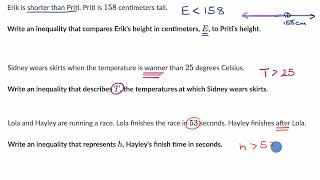
Representing situations with inequalities
Writing & solving inequalities in one variable
Graphing linear inequalities in two variables (part 1)
Graphing linear inequalities in two variables (part 2)
Solving problems with inequalities in two variables
Solutions to systems of linear inequalities in two variables
Solving problems with systems of linear inequalities in two variables
Unit 8: Functions
Describing & graphing situations
 Testing if a relationship is a function ✓ Check-ins2:23
 Relations and functions ✓ Check-ins6:57
 Recognizing functions from graph ✓ Check-ins4:07
 Checking if a table represents a function ✓ Check-ins1:16
 Recognizing functions from table ✓ Check-ins4:40
 Checking if an equation represents a function ✓ Check-ins3:33
 Does a vertical line represent a function? ✓ Check-ins1:40
 Recognizing functions from verbal description ✓ Check-ins1:31
 Recognizing functions from verbal description word problems ✓ Check-ins3:23
 Dependent & independent variables ✓ Check-ins2:19
 Interpreting a graph example ✓ Check-ins2:23
Function notation
Interpreting & using function notation
 What is a function? ✓ Check-ins7:57
 Function notation example ✓ Check-ins2:13
 Worked example: Evaluating functions from graph ✓ Check-ins0:44
 Evaluating discrete functions ✓ Check-ins3:20
 Worked example: matching an input to a function's output (graph) ✓ Check-ins1:07
 Worked example: two inputs with the same output (graph) ✓ Check-ins1:48
Using function notation to describe rules (part 1)
Using function notation to describe rules (part 2)
Features of graphs
 Introducing minimum and maximum points ✓ Check-ins5:30
 Worked example: absolute and relative extrema ✓ Check-ins4:58
 Increasing, decreasing, positive or negative intervals ✓ Check-ins5:56
 Worked example: positive & negative intervals ✓ Check-ins1:10
 Graph interpretation word problem: temperature ✓ Check-ins3:55
 Graph interpretation word problem: basketball ✓ Check-ins3:50
Using graphs to find average rate of change
Interpreting and creating graphs
Comparing graphs
Domain & range (part 1)
 Intervals and interval notation ✓ Check-ins9:36
 What is the domain of a function? ✓ Check-ins6:45
 What is the range of a function? ✓ Check-ins6:39
 Worked example: domain and range from graph ✓ Check-ins3:34
 Determining whether values are in domain of function ✓ Check-ins4:57
 Examples finding the domain of functions ✓ Check-ins4:25
 Worked example: determining domain word problem (real numbers) ✓ Check-ins2:19
 Worked example: determining domain word problem (positive integers) ✓ Check-ins2:34
 Worked example: determining domain word problem (all integers) ✓ Check-ins5:34
Domain & range (part 2)
Piecewise functions
 Introduction to piecewise functions ✓ Check-ins3:49
 Worked example: evaluating piecewise functions ✓ Check-ins4:24
 Interpreting a piecewise function graph ✓ Check-ins2:08
 Worked example: graphing piecewise functions ✓ Check-ins4:30
 Worked example: domain & range of step function ✓ Check-ins2:44
 Worked example: domain & range of piecewise linear functions ✓ Check-ins7:25
Absolute value functions (part 1)
Absolute value functions (part 2)
Solving equations with absolute values
Solving inequalities with absolute values
 Intro to absolute value inequalities ✓ Check-ins ✎ Fixed a slip13:13
 Solving absolute value inequalities 1 ✓ Check-ins3:27
 Solving absolute value inequalities 2 ✓ Check-ins4:39
 Solving absolute value inequalities: no solution ✓ Check-ins2:35
 Solving absolute value inequalities: fractions ✓ Check-ins7:30
Inverse functions
Finding and interpreting inverse functions
Writing inverse functions to solve problems
Using functions to model battery power
Unit 9: Introduction to exponential functions
Growing and growing
Patterns of growth
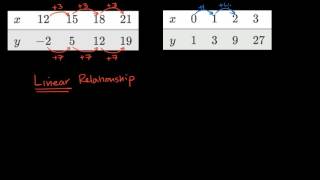
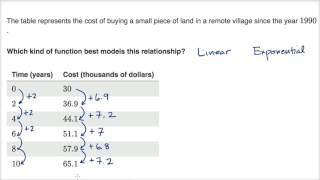
Representing exponential growth
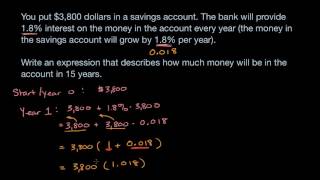 Exponential expressions word problems (numerical) ✓ Check-ins4:56
 The zeroth power ✓ Check-ins4:32
 Initial value & common ratio of exponential functions ✓ Check-ins5:27
 Exponential expressions word problems (algebraic) ✓ Check-ins3:36
 Interpreting exponential expression word problem ✓ Check-ins2:45
 Exponential function graph ✓ Check-ins5:32
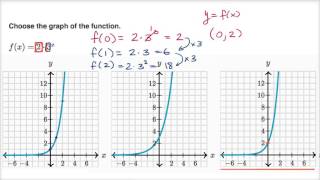 Graphs of exponential growth ✓ Check-ins4:21
Representing exponential decay
Understanding decay
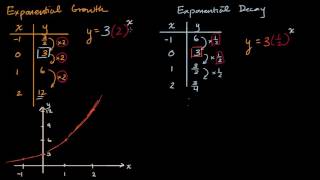
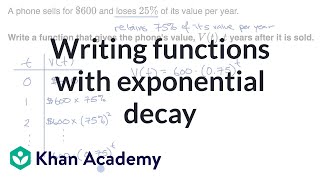
Analyzing graphs
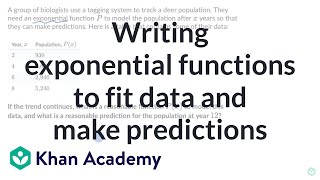
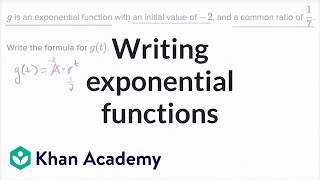 Writing exponential functions ✓ Check-ins1:40
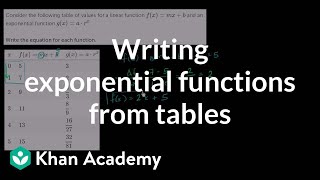 Writing exponential functions from tables ✓ Check-ins5:17
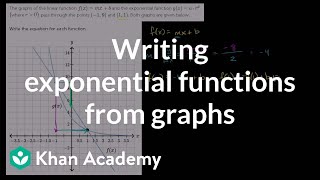 Writing exponential functions from graphs ✓ Check-ins7:25
 Analyzing tables of exponential functions ✓ Check-ins7:20
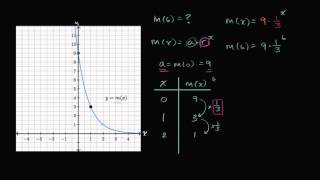 Analyzing graphs of exponential functions ✓ Check-ins4:06
 Analyzing graphs of exponential functions: negative initial value ✓ Check-ins6:07
 Modeling with basic exponential functions word problem ✓ Check-ins5:37
 Modeling car value over time with exponential decay ✓ Check-ins2:32
Using negative exponents
Exponential situations as functions
Interpreting exponential functions
Looking at rates of change
Modeling exponential behavior
Reasoning about exponential graphs (part 1)
Reasoning about exponential graphs (part 2) (optional)
Functions involving percent change
Compounding interest
Different compounding intervals
Expressed in different ways
Which one changes faster?
Changes over equal intervals
Predicting populations
Learn this with a class
With a class on Puzzicle this course runs as a timetable of live study parties: your batch watches together and answers the check-ins, sometimes with a teacher leading.
Course content © Khan Academy, used under CC BY-NC-SA. See this course on Khan Academy.