Statistics (TX TEKS)
Build statistics skills aligned to TEKS standards: analyze data, interpret probability, model trends, and make evidence-based conclusions. **Teaching this course? Check out our [teacher resources](https://classroom.khanacademy.org/teacher/library/en/math/statistics-tx/x2d551a71b7f6c307:statistics-tx-teks-teacher-resources)!**
9 units147 videos14 hours
Learn it live with a class on Puzzicle · Teachers: use it with your class
Unit 1: Representing one-variable data
Components of a data set
Representing one-variable categorical data

Representing one-variable quantitative data: frequency tables, dot plots, and stem-and-leaf plots
Representing one-variable quantitative data: histograms
Representing one-variable quantitative data: box plots
Unit 2: Analyzing one-variable data
Measures of center
IQR and percentiles
Outliers in one-variable data
Standard deviation
Describing the distribution of a quantitative variable
Comparing distributions of quantitative variables
Percentiles and z-scores
Normal distributions and the empirical rule
Normal distribution calculations
Unit 3: Two-variable data
Two-way tables
Marginal and conditional distributions
Scatterplots
Correlation
Lines of best fit
Interpreting slope and intercept
Unit 4: Sampling and experimental design
Statistical questions
Observational studies, surveys, and experiments
Results of observational studies, surveys, and experiments
Sampling methods and bias
Unit 5: Variability, probability, and random variables
Sources of variability
Probability and simulation
Probability calculations
Conditional probability and independence
 Conditional probability and independence ✓ Check-ins4:07
 Conditional probability tree diagram example ✓ Check-ins10:44
 Compound probability of independent events ✓ Check-ins6:00
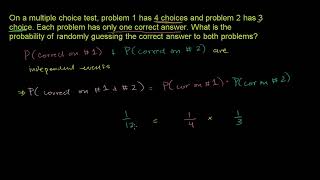 Independent events example: test taking3:56
 General multiplication rule example: independent events ✓ Check-ins2:29
 General multiplication rule example: dependent events ✓ Check-ins2:39
Random variables and probability distributions
Mathematical and statistical models
Unit 6: Sampling distributions
The Central Limit Theorem
Sampling distributions for sample proportions
Sampling distributions for sample means
Unit 7: Introduction to inference
Null and alternative hypotheses
P-values
Potential errors when performing tests
Unit 8: Inference for categorical data
One-proportion z-intervals
 Confidence interval example ✓ Check-ins ✎ Fixed a slip18:36
 Conditions for valid confidence intervals for a proportion ✓ Check-ins6:44
 Conditions for confidence interval for a proportion worked examples ✓ Check-ins ✎ Fixed a slip4:54
 Critical value (z*) for a given confidence level ✓ Check-ins6:22
 Example constructing and interpreting a confidence interval for p ✓ Check-ins6:35
 Determining sample size based on confidence and margin of error ✓ Check-ins8:01
One-proportion z-tests
 Constructing hypotheses for a significance test about a proportion ✓ Check-ins4:16
 Conditions for a z test about a proportion ✓ Check-ins5:33
 Calculating a z statistic in a test about a proportion ✓ Check-ins ✎ Fixed a slip4:51
 Calculating a P-value given a z statistic ✓ Check-ins5:27
 Making conclusions in a test about a proportion ✓ Check-ins5:14
Two-proportion z-intervals
Two-proportion z-tests
 Hypothesis test for difference in proportions ✓ Check-ins9:19
 Constructing hypotheses for two proportions ✓ Check-ins4:51
 Hypothesis test for difference in proportions example ✓ Check-ins ✎ Fixed a slip10:28
 Comparing P value to significance level for test involving difference of proportions ✓ Check-ins2:30
 Confidence interval for hypothesis test for difference in proportions ✓ Check-ins5:30
Unit 9: Inference for quantitative data
One-sample t-intervals
One-sample t-tests
 Writing hypotheses for a significance test about a mean ✓ Check-ins2:34
 Conditions for a t test about a mean ✓ Check-ins5:48
 Example calculating t statistic for a test about a mean ✓ Check-ins5:02
 Using TI calculator for P-value from t statistic ✓ Check-ins3:19
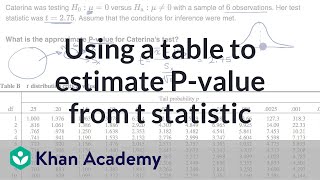 Using a table to estimate P-value from t statistic ✓ Check-ins4:53
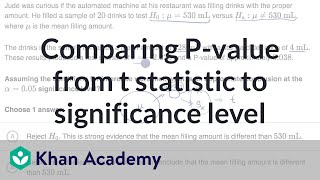 Comparing P-value from t statistic to significance level ✓ Check-ins3:39
Two-sample t-intervals
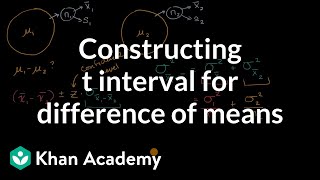
Two-sample t-tests
 Hypotheses for a two-sample t test ✓ Check-ins4:00
 Example of hypotheses for paired and two-sample t tests ✓ Check-ins3:49
 Two-sample t test for difference of means ✓ Check-ins6:56
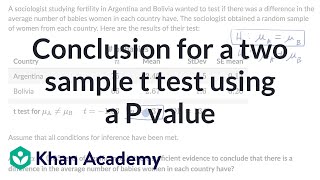 Conclusion for a two-sample t test using a P-value ✓ Check-ins2:29
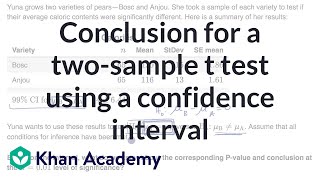 Conclusion for a two-sample t test using a confidence interval ✓ Check-ins3:46
Learn this with a class
With a class on Puzzicle this course runs as a timetable of live study parties: your batch watches together and answers the check-ins, sometimes with a teacher leading.
Course content © Khan Academy, used under CC BY-NC-SA. See this course on Khan Academy.